The products and services mentioned in this article may not be available in your region. Please reach out to customer support or your account manager if you have questions.
How to measure customer satisfaction

Customer satisfaction is essential to building a trusted reputation, reaching new customers, and earning repeat business. For something that valuable, you don’t want to be left guessing. Measuring customer satisfaction is an important step in understanding how satisfied your customers are and identifying tangible opportunities for improvement.
In this article, we'll provide a comprehensive overview of how to measure customer satisfaction, including:
Metrics to measure customer satisfaction
Measurement typically starts with data. Most businesses today have access to plenty of data—the challenge is determining which metrics provide the most useful insights for particular goals. For measuring customer satisfaction, the main metrics to consider can be divided into a few key categories:
Survey data
One of the best ways to gain data about how your customers feel is to ask them through surveys. Common survey options for gathering customer satisfaction data include:
→ Customer satisfaction score (CSAT)
The CSAT score is a survey result that measures how satisfied a customer is with your company. To find your CSAT scores, provide customers with a survey that asks them to rate how satisfied they are with your products or services on a particular scale. You could choose a numerical scale (like 1 to 10) or use emojis (😢to 😃).
CSAT scores give you a way to turn something subjective—how happy or sad a customer is—into a quantitative metric. By taking the average of all responses, you gain a snapshot of how well you’re doing with customers.
One shortcoming of the CSAT is that, on its own, it doesn’t provide much information about why a customer feels the way they do about your brand. But by using CSAT scores to gain a general sense of how your customers feel, you can determine the next steps toward understanding what’s behind those feelings and how to improve them.
→ Net Promoter Score (NPS)
The NPS gauges how happy a customer is with your brand by asking how likely they are to recommend you to a friend or colleague. To find your NPS, send customers a survey that asks them to provide a rating of their likelihood to recommend you to others, generally on a scale of 1 to 10.
As with the CSAT score, the NPS helps you translate subjective feelings of loyalty toward your brand into numerical data that’s easy to understand. It’s a good companion to the CSAT score to help you gain further insights into how happy customers truly are. Being satisfied for their own sake is one thing, but liking you enough to rave to their friends about you suggests a stronger sentiment.
→ Customer effort score (CES)
The CES helps you measure whether customers find a particular aspect of doing business with your brand difficult. To collect this score, you provide customers with a survey right after they complete an action. The survey asks how easy or difficult they found that action. You can use the CES to measure ease of use for any aspect of the customer’s journey—a sales inquiry, the checkout process, a customer service experience—anything you feel may impact customer satisfaction.
As with the other survey scores, the main potential downside of the CES is that it depends on customer reporting. You have to ask customers to exert more effort to provide that feedback, which some won’t bother doing. Those who do will help you gain data that you can extrapolate from to estimate how others feel.
Behavioral data
Analytics that help you understand customer behavior can be another good indicator of customer satisfaction. Below are a few types of behavioral data worth tracking.
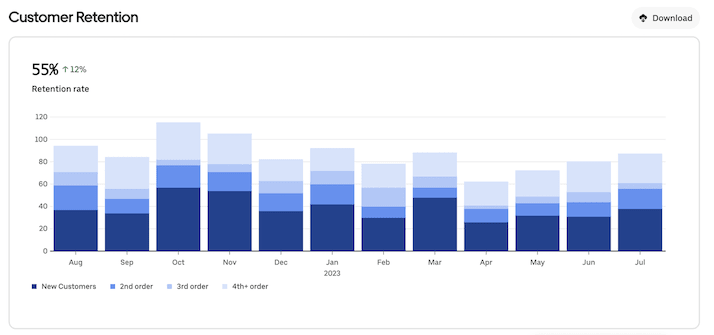
→ Customer retention rate
Your customer retention rate is the percentage of customers you’re able to keep over a set period of time. To find your retention rate, select a specific time frame, such as a month or a year. Determine the number of existing customers you had at the beginning of that time period (E), along with the total number of customers you had at the end of that time (T). Then figure out how many new customers you added in that same time frame (N). Once you have those values, the equation is:
This metric can be tricky for businesses that don’t offer a subscription product or loyalty program, as there may be no clear moment of “cancellation” to let you know when you’ve lost an existing customer. To help find your customer retention rate in that case, you can define what counts as an existing customer based on typical order frequency.
→ Customer lifetime value (CLTV)
CLTV measures how much you anticipate making from each customer over the entire length of your relationship. CLTV helps you quantify the value of earning customer loyalty by applying a long-term view to what each customer you gain is worth to you. To find your CLTV, calculate the average value of each customer you earn for a set period of time. Then multiply that number by the average (or predicted) customer life span. The equation for this is:
For example, if a grocery customer typically makes weekly orders worth an average of $100 each, their value in a year would be $5,200. If you can keep their loyalty for 10 years, their estimated CLTV would be $52,000. That really puts into perspective how valuable earning customer loyalty is.
One limitation of the CLTV metric is that it’s an estimate. A lot of unpredictable factors influence how long a customer will do business with your company and why, so you’re reliant on guesswork here. Nonetheless, it helps provide a good idea of what to expect.
→ Abandonment rate
Abandonment rate measures how many customers give up on an action before completing it. For businesses, there are 2 main instances where abandonment rate comes into play:
- Conversion funnel. If you break down the customer’s journey into the steps that lead to a sale, you can track at what point customers abandon that journey. A high abandonment rate at a certain point in the sales process can reveal a specific problem to solve. If customers often add items to their shopping cart without checking out, it might mean your checkout process is too onerous or shipping fees too high.
- Customer service. In customer service, the abandonment rate is the percentage of customers who give up on their customer service inquiry before a resolution. If a customer stuck on hold hangs up before reaching an agent, you can bet they aren’t satisfied. A high customer service abandonment rate points to issues with your customer service process to work on.
One issue to be aware of when measuring abandonment rates is that they only reveal when customers are abandoning a task and how many of them do so. You’ll need to do additional work to understand why it’s happening and what to do about it.
→ Churn rate
Churn rate measures how many customers stop doing business with your company. A high churn rate is a serious indication that customers aren't getting what they need from your brand.
To calculate churn rate, choose a specific period of time to look at, such as a year. Find the number of customers you had at the beginning of that period and the number you have now. If there has been a decrease, calculate how many fewer customers you have now. Then use this calculation:
Churn rate can be a useful metric for many businesses, but as with retention rate, it can be tricky to calculate depending on your business model. For a business that sells subscription products or items that regularly need to be replenished, like groceries, tracking it is fairly straightforward. Some other businesses may have a harder time identifying a lost customer versus one who’s between purchases. In that case, you can make an educated guess based on order frequency.
Customer service data
Every customer service experience someone has with your brand impacts their satisfaction with your business. Some good customer service metrics to consider are listed below.
→ First response time (FRT)
FRT is a customer service metric that tracks how long it takes between when a customer first reaches out to your support team and when you send a response. A customer stuck spending hours or days waiting for a response is unlikely to be satisfied with their experience. Tracking FRT provides you with an easy way to determine if your support staff typically gets back to customers in a timely manner or if it’s an issue you need to work on.
First response time is important, but getting a first response isn’t ultimately as important to customers as getting help solving their problem. So this metric is much more useful when you consider it in combination with other customer service metrics (such as the others covered in this section).
→ First contact resolution (FCR)
FCR is the percentage of customer service inquiries that your support team manages to resolve in their first response. A support issue that requires prolonged back-and-forth communication can be frustrating for customers and support staff. The higher you can get your first contact resolution, the more satisfied customers will be with your service. You can find FCR with this equation:
Some support inquiries will inevitably require more contact than this to effectively resolve. As such, prioritizing a satisfying resolution is more important than emphasizing a fast one alone. For simple customer issues, though, resolving them in your first response is a good goal to have.
→ Ticket resolution time (TRT)
TRT, sometimes called TTR (time to resolution), is the total amount of time it takes to resolve a customer service inquiry. Taken in combination with FRT and FCR, it helps provide a full picture of how quickly and effectively you’re solving customer problems. A long TRT suggests that your customer service team may need to rethink your processes and introduce efficiencies.
One limitation of customer service metrics related to speed is that they don’t necessarily track how happy customers are with their overall support experience. Using these metrics in combination with the other metrics and methods we cover here will help you gain a fuller picture.
Methods of measuring customer satisfaction
Determining which metrics to track is only one part of developing a strategy to measure customer satisfaction. You also need to decide what methods to use to understand how satisfied customers are. Some of your best options include those listed below.
Analytics tools
Many of the metrics covered in this article are easy to access with the right software tools. While you may be able to track and calculate some of this data manually, it’s much simpler to let technology do it for you. And you’ll likely find some of these metrics—or the values needed to calculate them—in tools you already have.
Here are some common software products that include customer satisfaction data:
Point-of-sale (POS) systems. POS systems will help you keep track of sales data and can be useful in finding your churn rate, retention rate, and CLTV.
Customer relationship management (CRM) software. CRM software helps you track your relationships with customers throughout the customer journey. It can capture high-level trends in your customer relationship data and help you track the details of individual customer accounts.
Customer service software. This type of software often automates the process of collecting data like FRT, FCR, and TRT. Some products also include survey features for gaining NPS and CSAT scores.
Third-party delivery platforms. The delivery experience can play a key role in customer satisfaction. Third-party delivery platforms platforms often provide analytics—such as ratings, reviews, and customer retention—to track how satisfied customers are with their orders.
Interviews
When it comes to understanding how customers really feel, nothing beats talking to them. To add more color and detail to the insights you gain from your metrics, set up interviews with your customers. Ask them how they feel about different aspects of the experience of working with you. Conversations can help you understand the feelings behind the data and the reasons behind those feelings.
Live chat
Live chat is an increasingly popular channel for companies to offer for sales and customer service, and it can provide additional insights into customer satisfaction. Customers who use your live chat option directly communicate what they’re looking for and any questions they have in a format that’s easy to track. You can also program your live chat tool to ask customers for feedback about their live chat experience.
Observation
Some of the methods we’ve covered here apply more to online interactions than in-person ones, but for many businesses the in-person store experience is still a huge part of how customers connect with your brand. You can learn a lot about how they feel by simply paying attention to their behavior when they’re in the store. Train employees to make note of how customers act while shopping and how customers answer when asked about their experience. This method is a bit more old-fashioned than the others, but it’s just as valuable.
Reviews
Many customers will tell you outright how they feel about your brand by leaving reviews. Develop a regular habit of reading those reviews to learn what customers think. Positive reviews are a great way to gain confirmation about what you’re doing right. But also pay close attention to negative reviews to gain insight into some of the main issues to address.
Social media
Customers frequently use social media in 2 main ways that are relevant here:
- As an additional customer service channel when they have questions or complaints
- As a channel to voice their feelings about a brand to their followers
For the first purpose, they’ll usually come to you directly. You can track the issues they surface, as well as how your team responds, creating additional customer service data.
For the second category, you can use social listening tools that track brand and product mentions to gain intel on what people are saying. Some social media tools even offer sentiment analysis to help you understand how people feel about your brand based on their social media posts.
Surveys
Surveys are a good middle option between the quantitative value of data and the qualitative insights you gain from methods like interviews and reviews. You can use surveys not only to gain data, as with CSAT and NPS, but also to ask more open-ended questions that provide additional detail about customers’ feelings.
Here are a few common options for sending surveys:
- Emails
- Phone calls
- Texts
- On your website
- Within a mobile app
You may already have software tools that include survey features, such as your email marketing or customer service products. You can also find software tools specifically designed for providing surveys, including some that offer free versions, like Google Forms and SurveyMonkey.
How to measure customer satisfaction: 6 steps
Measuring customer satisfaction is clearly a big topic. After reviewing all the metrics and methods at your disposal, you may be wondering how to break the work into specific, actionable steps. Read on for a 6-step plan to help you do that.
1. Outline your goals
Any good strategy starts with clarifying what you want to accomplish. Be specific about what you want to get out of measuring customer satisfaction. Beyond naming general goals like “increase customer satisfaction,” think of more targeted, measurable objectives, like “grow referral business.”
2. Define your metrics
Determine which customer satisfaction metrics best align with the goals you’ve chosen, and make those the focus of your measurement efforts. Record the current values for those metrics. That’s the starting point you want to improve upon. Then select the specific time frame you’ll use to measure progress, so you have a clear end result to compare with your initial numbers. This period should be long enough to track any meaningful change—probably at least a month, but more likely a longer period such as a year.
3. Execute your research
Develop a strategy to enhance the intelligence you have now for each goal. If your aim is creating a better experience for loyal customers, that might mean sending surveys to some of your top customers. If you’re focused on improving the customer service experience, you might set up automated surveys to go out after each customer service interaction. The methods you employ will depend on the goals you want to achieve. Start there and determine the best way to gain knowledge on where you stand now. Using a mix of quantitative and qualitative methods is a smart strategy. Data provides an objective overview, while qualitative intel helps you fill in the why behind the data.
4. Analyze your data
Take time to evaluate all the information you’ve gained from your research. What does it tell you about your customers, their priorities, and their feelings about you? If the data doesn’t provide the full story, add more-qualitative methods to your research process before moving forward. Reach out to customers to ask them why they feel the way they do. Revisit your reviews to see if they fill any gaps in your knowledge, or send out surveys with open-ended questions.
5. Take action
Use everything you’ve learned to determine action items your business can take to improve customer satisfaction. That could mean improving your products, tightening your customer service processes, or looking for ways to increase convenience for customers both online and off. Let the data lead you, and you can move forward with confidence that the steps you take will lead to happier customers.
6. Repeat
Once you’ve completed this process, you’re still not done. Measuring and improving customer satisfaction is ongoing. You may want to tweak your methods or goals as you go, but commit to making this a continual system. Over time, you’ll gain historical data that gives you an even deeper picture of what your customers care about, which will help you achieve better results as you build on what you learn.
Improve your customer satisfaction with Uber Eats
Businesses that work with Uber Eats can access additional features for gaining insights into customer satisfaction:
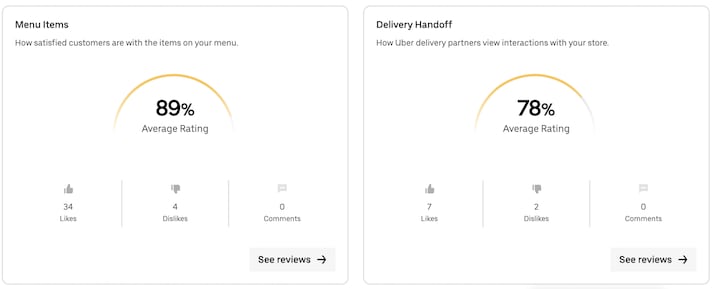
- Ratings. After each delivery, customers are prompted to rate their experience. You can see ratings for different aspects of the customer experience, including:
- Menu items. See how happy customers are with specific products and menu items, to better understand how satisfaction correlates with the items ordered.
- Delivery handoff. Measure how satisfied delivery people are with their interactions with your restaurant.
- Overall experience. View their rating for their overall experience with each order they place.
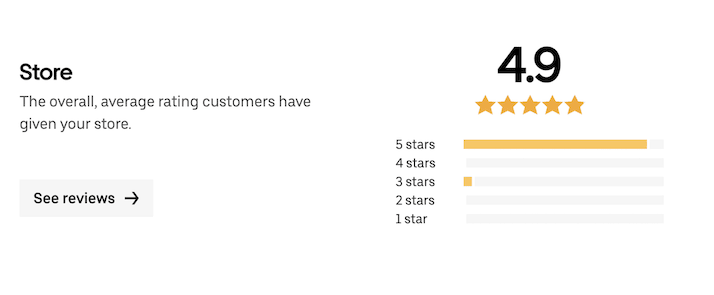
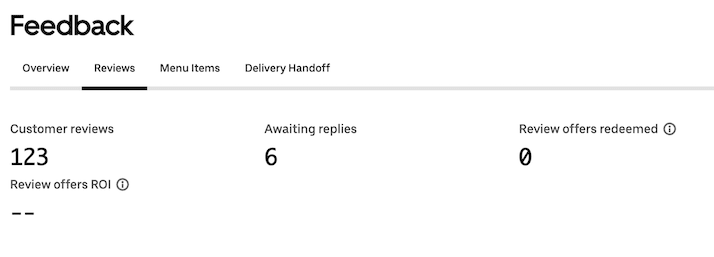
- Reviews. Beyond the ratings, customers have the option to provide reviews to offer more detail on their experience and help you understand why they rate you the way they do.
- Churn rate. Uber Eats shows you the percentage of lapsed customers you have for a set time period, to help you track what portion of customers fail to return.
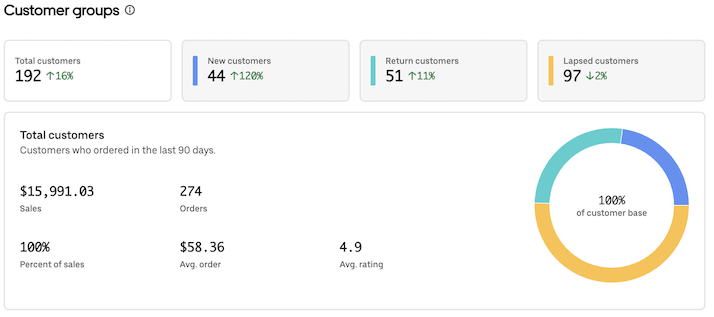
- Customer retention. Uber Eats shows not only your overall retention rate but also how often customers are placing repeat orders in a given period.
Uber Eats doesn’t just provide data on how satisfied customers are. The platform also provides businesses the ability to respond to reviews and ratings. When a customer is unsatisfied, you can step in to make the situation right. When they’re happy with an order, you can use the feature to nurture the relationship and increase loyalty.
For businesses already working with Uber Eats, log in to Uber Eats Manager and navigate to the Performance tab. From there, you can explore metrics, feedback, and reviews to understand—and improve on—customer satisfaction. If you haven’t partnered with Uber Eats yet, sign up today to delight your customers with fast, convenient delivery options.
Services
Services
Technology
Manage orders
Simplify operations
Grow your sales
Reach customers
Who we serve
Who we serve
Pricing
Resources
Customer Hub
Learn
Contact us